Dashboards
When the Entry & Exit Compliance module is enabled, the homepage for Mirador Insights becomes the Dashboard. Clicking the Mirador castle icon in the top-left will bring you back to the homepage from anywhere within the application.
Jump to:
Administrator & Supervisor Dashboard
Within the Dashboard you’ll find quick summary cards for your whole account’s activity as well as dynamic charts for visibility into multiple organizations and departments across your application, as determined by your role permission.
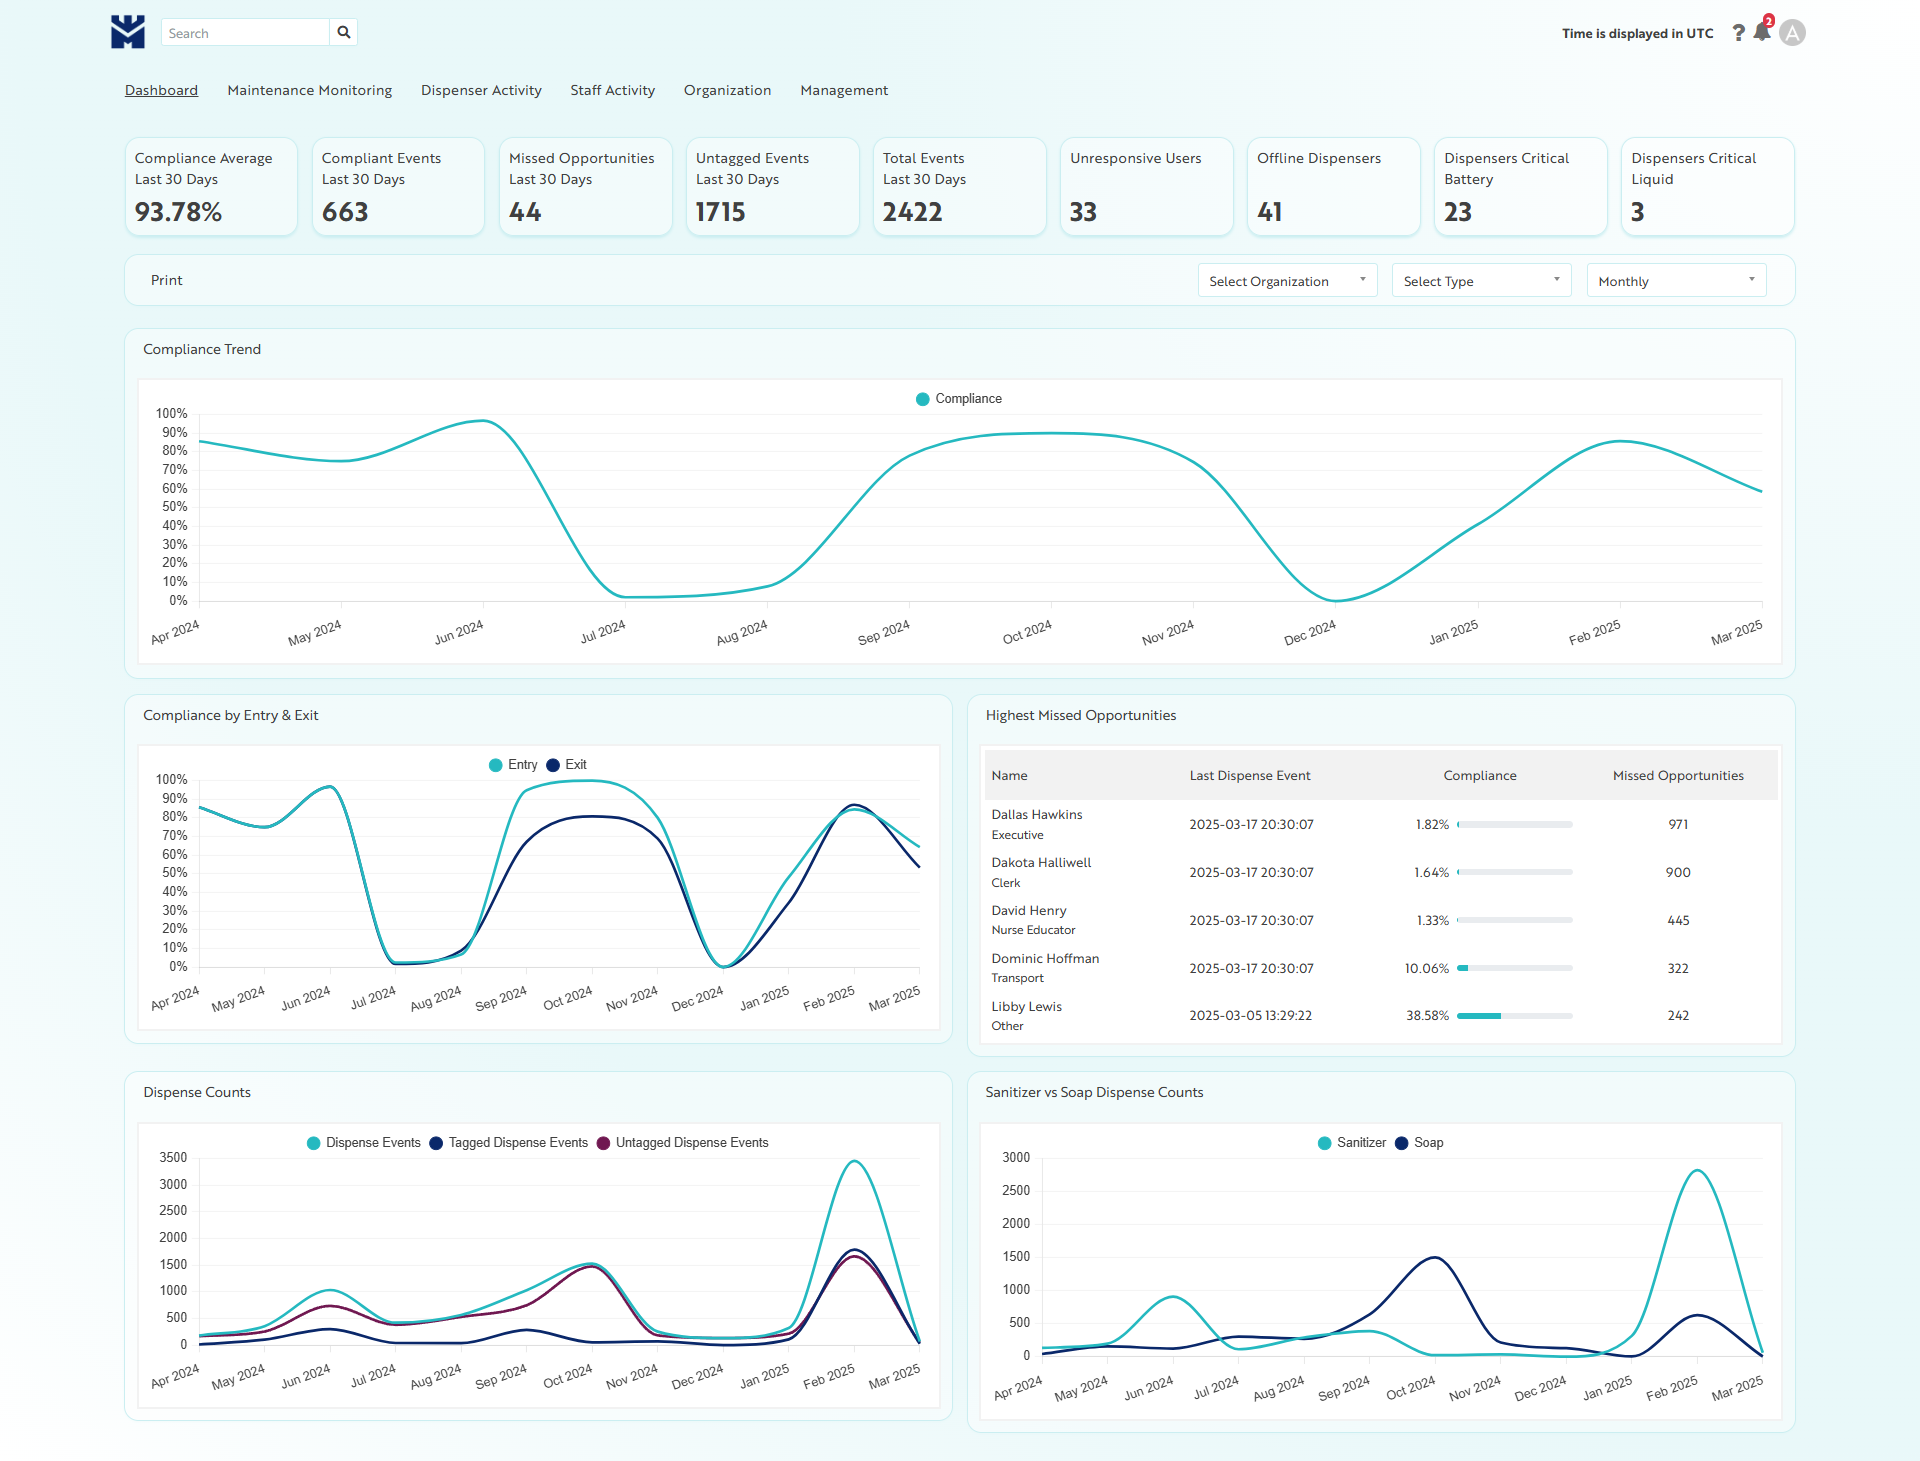
Summary Cards
The summary card displays a count for the following event types and date ranges:
- Compliance Average: Last 30 Days
- Compliant Events: Last 30 Days
- Missed Opportunities: Last 30 Days
- Untagged Events: Last 30 Days
- Total Events: Last 30 Days
- Unresponsive Users: All Unresponsive Users
- Offline Dispensers: All Inactive Dispensers
- Low Battery: All Dispensers with a Low Battery Alert triggered
- Low Liquid Level: All Dispensers with a Low Liquid Alert triggered
See our article 📄 How does Compliance work? for more information on how we use each of these calculations within Insights.
Charts
Dynamic charts on the dashboard can be adjusted for various organizations, user roles and date ranges. For example:
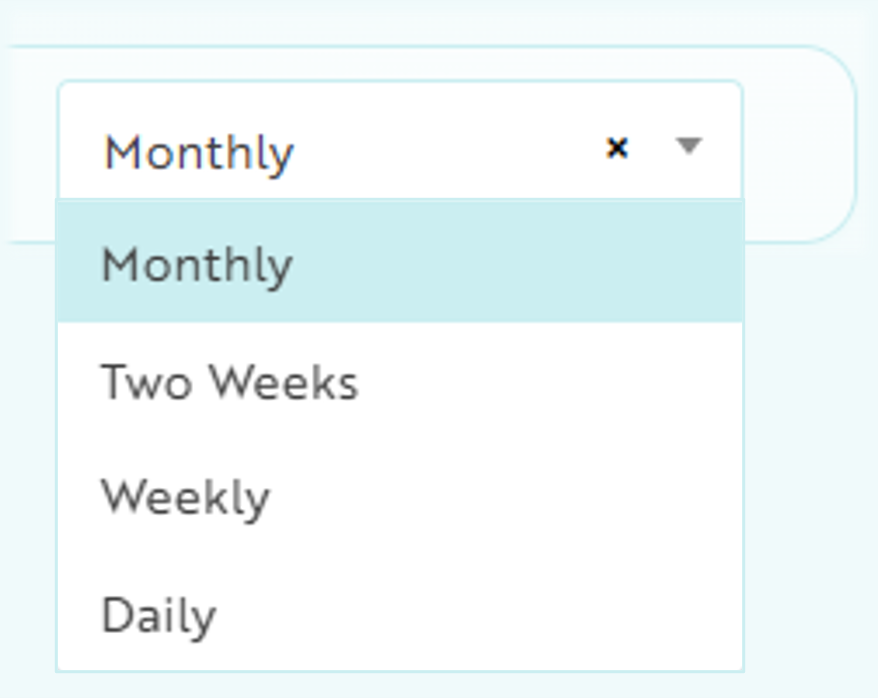
- Date ranges are displayed as rolling time periods, and the default date range is a rolling month view
- Click the drop-down box in the top-right corner of the navigation bar to select a different date range
The graphs are provided for easy visualization of the following event types:
- Compliance Trend
- Compliance by Room Entry & Exit
- Compliance Rank - Highest Missed Opportunities
- Sanitizer vs. Soap Dispense Counts
Click within a graph to see the applicable reporting page, where you can view different date ranges or create report exports as needed.
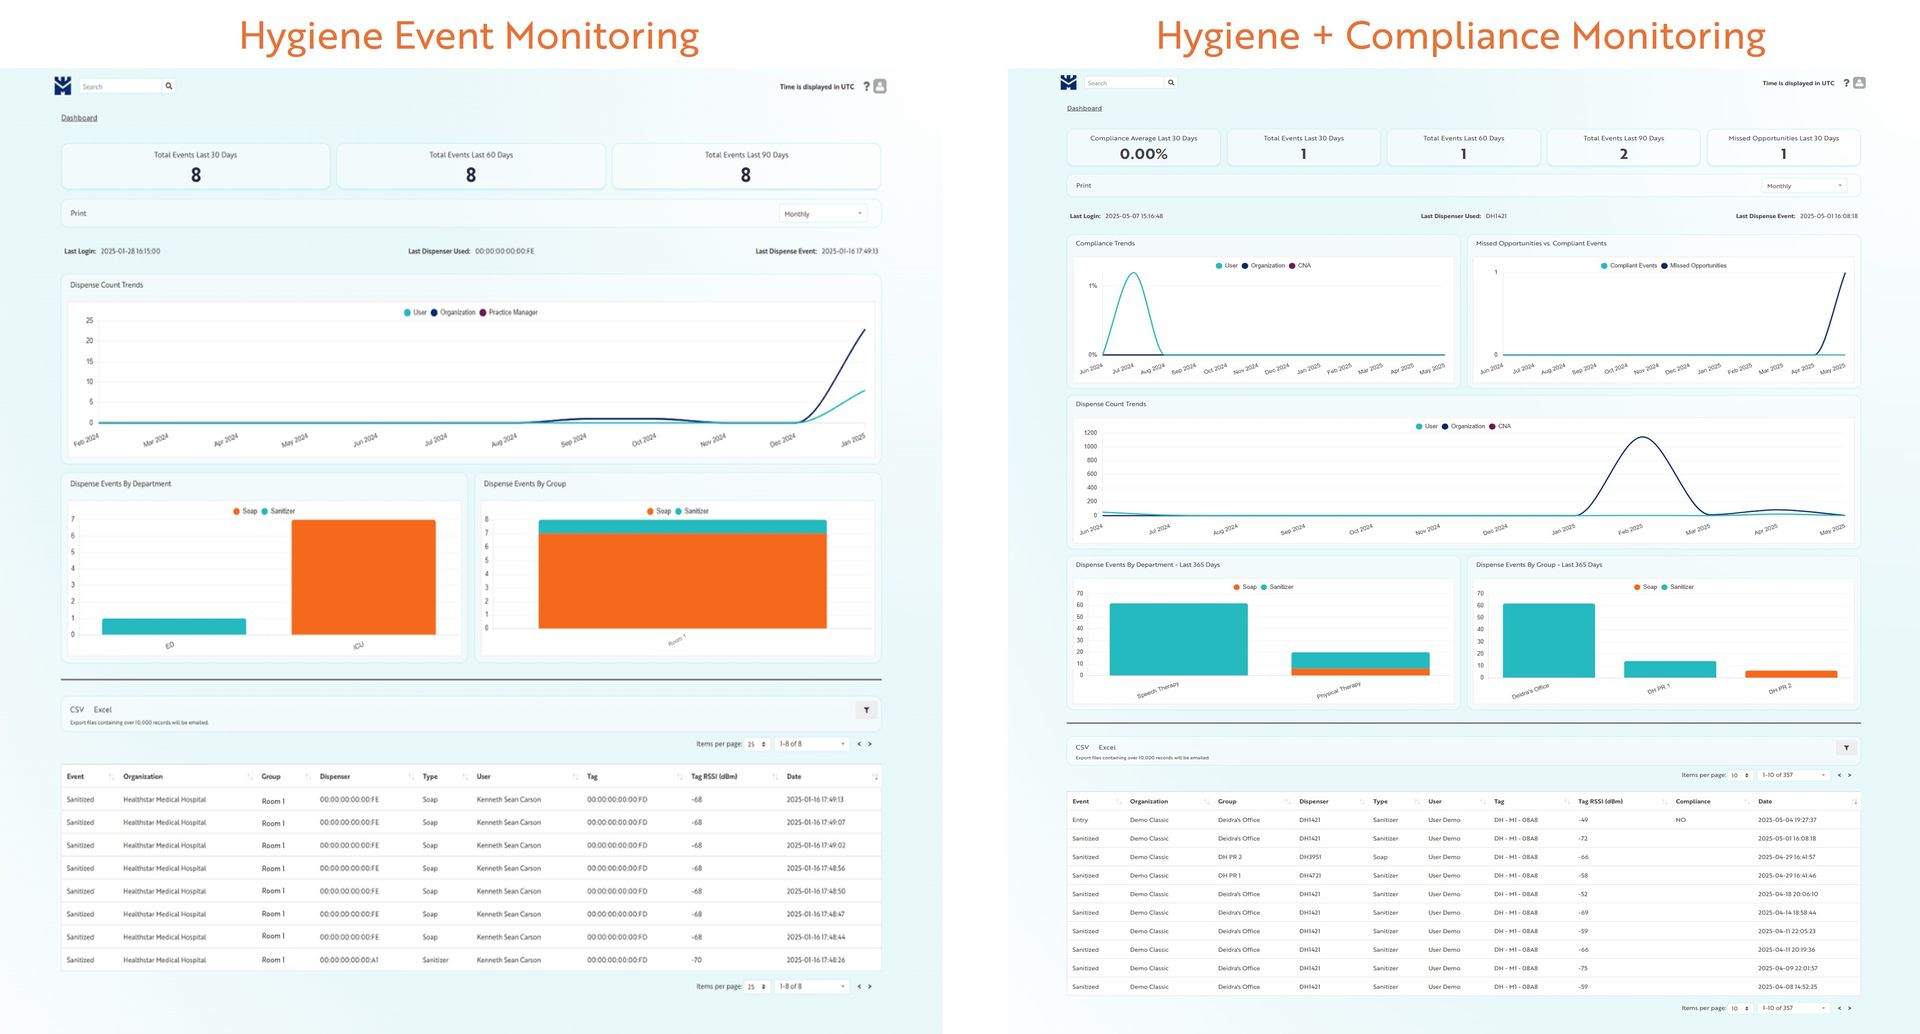
User Dashboard
When the module is enabled, Staff Users (those without Admin or Supervisor role permissions) are granted the ability to log in with their designated email address, and are presented with a different experience upon login.
If you are designated as a Staff User, your Dashboard will contain quick summary cards and dynamic charts for quick views of your own activity across the application dependent on the modules your organization has enabled.
Should you need access to supervisor-level reporting for multiple users or departments, please contact your Mirador Administrator.
Summary Cards
The summary card displays at a glance metrics for the following event types over the last 30 days:
- Compliance Average
- Sanitization Counts
- Missed Opportunities
Charts
Dynamic charts on the dashboard can be adjusted for different date ranges. For example:
- Date ranges are displayed as rolling time periods, and the default date range is a rolling month view
- Click the drop-down box in the top-right corner of the navigation bar to select a different date range
The graphs are provided for easy visualization of the following event types:
- My Compliance
- Missed Opportunities vs. Dispense Events
- Dispense Events by Department & Group
Related Records